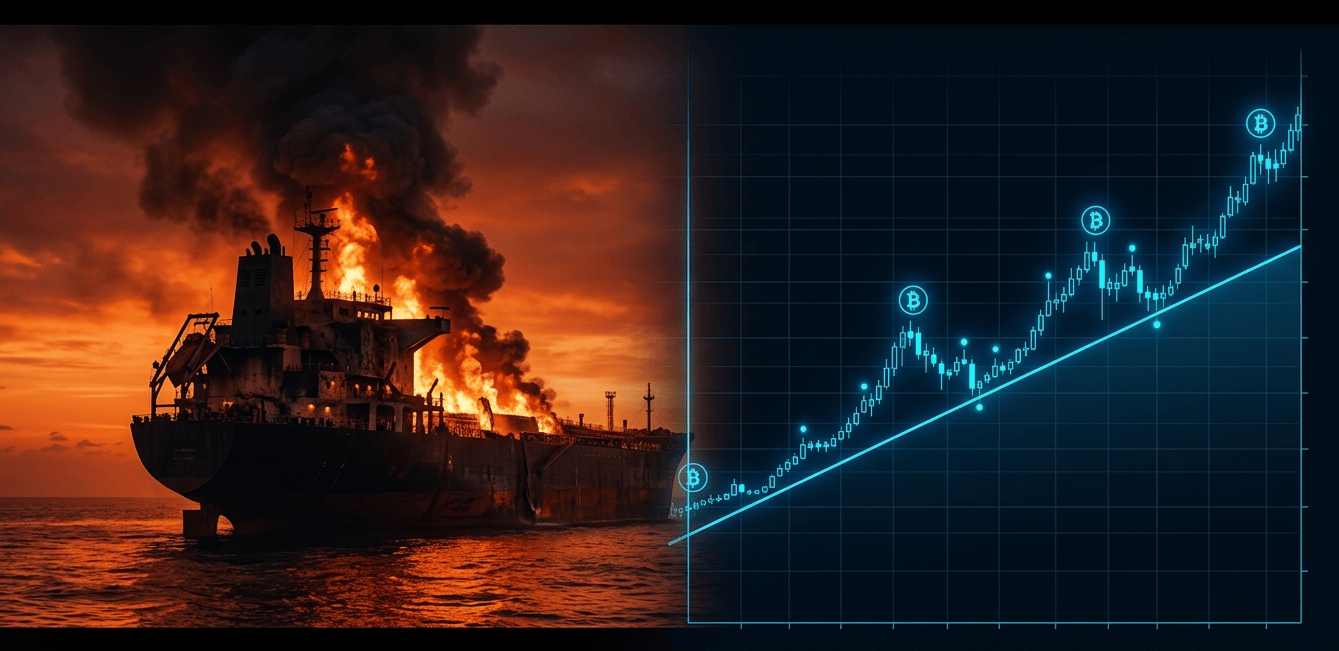
On February 28, 2026, the United States and Israel launched coordinated airstrikes on Iran. Oil prices surged. Equities braced. And Bitcoin — the only major liquid asset trading on a Saturday afternoon — did something the world watched in real time: it fell sharply, then recovered. Then fell again on the next headline. Then recovered again, each time at a slightly higher low.
Three weeks into an active war involving missile exchanges, tanker attacks, the partial closure of the Strait of Hormuz, and direct threats to Iran’s energy infrastructure, the crypto market has become the world’s most sensitive geopolitical risk indicator. This is a data-driven breakdown of what has happened, why it matters, and what the numbers say about where we go next.
Live Market Snapshot — March 25, 2026
| $71,308 Bitcoin (BTC) | $2,164 Ethereum (ETH) | $2.51T Total Mkt Cap | 14 Fear & Greed Index |
| Asset | Price (USD) | 24h Change | 7d Change | Since Feb 28 | Notes |
| Bitcoin (BTC) | $71,308 | +3.0% | -2.1% | +11% | Rising floor; peace plan catalyst |
| Ethereum (ETH) | $2,164 | +1.7% | -9.2% | -8% | Worst major over 7 days |
| XRP | $1.42 | +0.2% | -8.5% | -11% | Amplifies BTC moves |
| Solana (SOL) | $91.69 | +2.5% | -3.8% | -5% | Moderate resilience |
| BNB | $638 | -0.5% | -6.8% | -4% | Stable relative to alts |
| DOGE | $0.094 | +1.7% | -7.5% | -12% | High-beta to sentiment |
| Tron (TRX) | N/A | +0.8% | +4.4% | +6% | Only green major weekly |
| Brent Crude | $99.55 | -4.7% | +18% | +30% | Broke below $100 today |
| Gold | $4,396 | -1.56% | 4.70% | -17% | Safe haven underperforms |
| S&P 500 | $6,591 | 0.54% | 0.04% | -1% | Resilient vs altcoins |
Sources: CoinDesk, CoinGecko, Bloomberg, Interactive Crypto. Data as of March 25, 2026 UTC morning.
1. How the War Started — and Why Crypto Was the First Market to React
February 28, 2026 — a Saturday. US and Israeli jets begin coordinated strikes on Iranian nuclear and military infrastructure. Equities are closed. The bond market is closed. Oil futures won’t open until Sunday evening. But Bitcoin is always open.
Within minutes of the first reports, Bitcoin dropped 8.5% to $63,255 — the only major asset in the world pricing the war in real time. By Sunday evening it had already rebounded above $68,000. That single fact tells you almost everything you need to know about crypto’s new role in global finance.
| “Bitcoin was the first asset to price the Iran war because it was the only liquid market open when the US and Israel launched their attack on a Saturday.” — CoinDesk, March 15, 2026 |
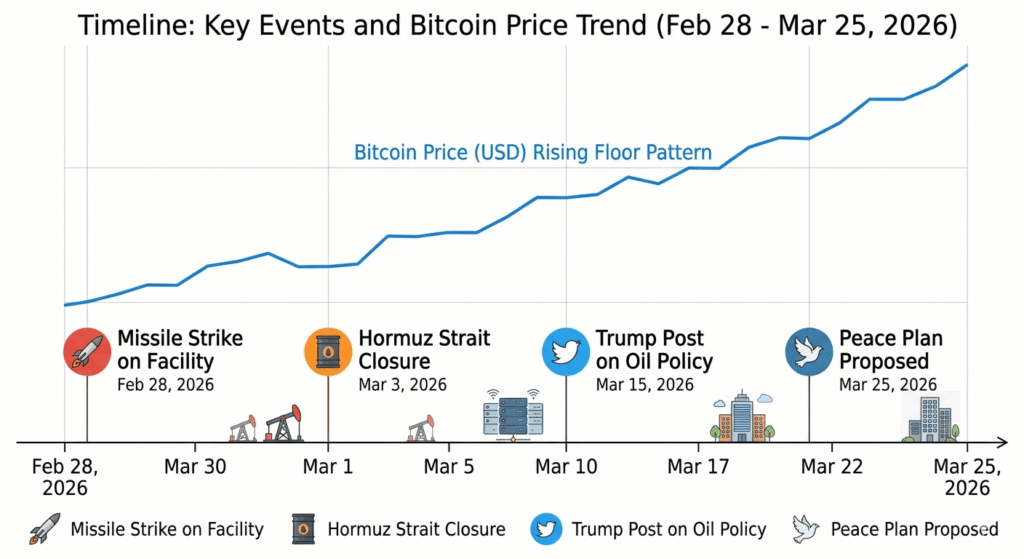
What followed was a pattern unlike any previous geopolitical event. Rather than a single crash-and-recover, the market has experienced a repeating cycle: every new escalation triggers a sell-off, followed by buyers stepping in at a higher floor than the last time.
| Date | Event | BTC Low | Move |
| Feb 28 | Initial US-Israel strikes on Iran | $63,255 | ↓ 8.5% |
| Mar 2 | Iran retaliatory missiles hit Gulf states | $66,000 | ↓ then recovery |
| Mar 4 | Iran closes Strait of Hormuz | $68,000 | Floor holds |
| Mar 7 | Week 1 consolidation | $68,000 | ↑ Rising floor |
| Mar 12 | Tanker attacks in the Gulf | $69,400 | ↑ Higher low |
| Mar 15 | Kharg Island strike | $70,596 | ↑ Higher low |
| Mar 17 | Bitcoin hits war-era high | $75,000 | ↑ Peak |
| Mar 22 | Trump threatens Iran power plant strikes | $68,000 | ↓ $1B+ liquidated |
| Mar 23 | Trump postpones strikes; “productive talks” | $71,811 | ↑ 5% surge |
| Mar 25 | US 15-point peace plan reported; oil -4.7% | $71,308 | ↑ +3% today |
Sources: CoinDesk, Bitcoin Magazine, InvestingNews. Timeline compiled from multiple reports.
2. Oil, Inflation, and the Fed: The Macro Trap Squeezing Crypto
The single biggest macro variable driving crypto throughout this war has not been the missiles. It has been oil. Brent crude rose roughly 30% in the weeks after February 28, briefly pushing back above $100 per barrel as Iran closed the Strait of Hormuz and attacked tankers in the Gulf.
That oil spike feeds directly into a chain of consequences that hurts crypto:
- Higher oil → higher inflation: Wholesale PPI for February came in at 3.4% annually, well above expectations.
- Higher inflation → Fed stays tight: The Federal Reserve’s March 18 meeting signalled only one rate cut for the full year. Bitcoin fell roughly 5% on that decision alone.
- Tight rates → risk assets suffer: Bitcoin’s correlation with the S&P 500 hit 89% during the March 19 sell-off, its highest in months.
- Tight rates → bullish catalyst delayed: Rate cuts were widely expected to be the key driver of a 2026 crypto bull run. Every hawkish signal pushes that timeline further out.
| As of March 25, Brent crude has broken back below $100 for the first time in weeks — trading at $99.55 after the 15-point peace plan was reported. Analysts say BTC needs oil to stabilise between $80–$85 before rate cut expectations can meaningfully revive and sustain a crypto rally. (247WallSt, 2026) |
3. Trump’s Posts Move Markets Instantly: The New Volatility Driver
The most unusual feature of this conflict’s impact on crypto has been the direct, near-instant connection between the US President’s public statements and Bitcoin price moves. The pattern has played out multiple times:
March 22 — The Obliterate Post
Trump posted a threat to “obliterate” Iran’s power plants if Tehran did not reopen the Strait of Hormuz. Within one hour of the post:
- Over $240 million in crypto positions were liquidated
- Total liquidations crossed $1 billion within 24 hours
- 85% of liquidated positions were longs
- Bitcoin dropped from $75,000 to $68,241
- XRP fell 2.6% to $1.37; Ethereum dropped to $2,114
- Total crypto market cap lost roughly $55 billion
March 23 — The Postponement Post
Five days later, Trump announced a postponement of the strikes, citing “very good and productive” talks with Tehran. Bitcoin jumped 5% within minutes to $71,811. WTI crude dropped 11% and Brent fell 8%, triggering over $62 million in tokenised Brent futures liquidations in the opposite direction. The speed and scale of these moves illustrates a structural reality: crypto is now the world’s primary real-time geopolitical risk instrument, and it is deeply sensitive to the words of a single leader.
4. Bitcoin vs. Other Assets: The Performance Scorecard
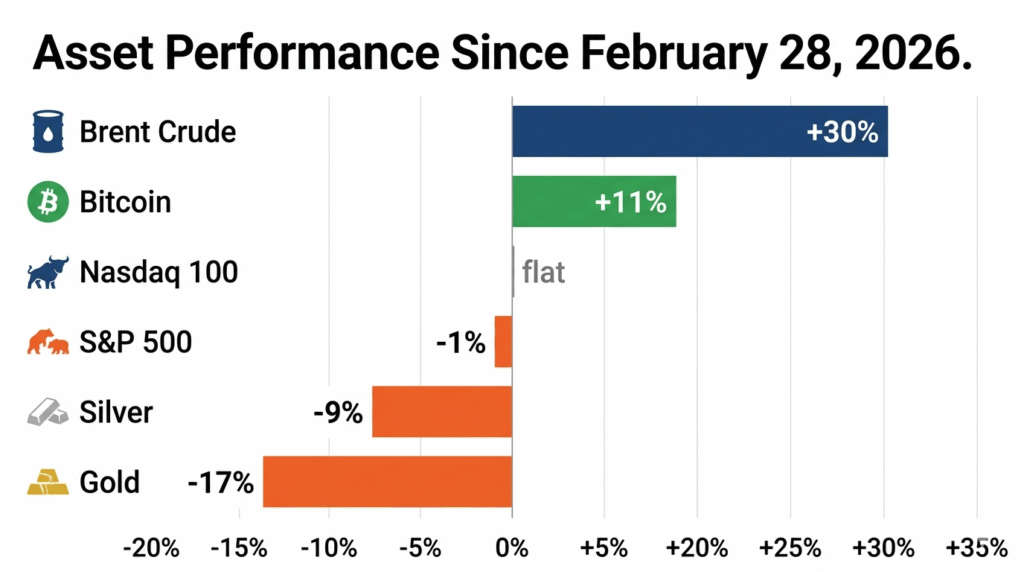
Despite the turbulence, the bigger story is one of remarkable relative strength. Bitcoin has outperformed every major traditional asset class since the war began.
| Asset | Pre-War Level | Current Level | Change Since Feb 28 |
| Bitcoin (BTC) | ~$64,200 | ~$71,308 | +11% |
| S&P 500 | Baseline | Approx flat | -1% |
| Nasdaq 100 | Baseline | Largely flat | Flat |
| Gold | Pre-war high | ~17% lower | -17% |
| Silver | Baseline | Lower | -9% |
| Brent Crude | ~$68 | ~$99 | +30% |
Sources: CoinDesk (March 12 & 15, 2026), Bloomberg (March 10, 2026), 247WallSt (March 23, 2026)
Gold’s -17% performance since the war began is particularly striking. For decades, gold was the default safe-haven asset in times of geopolitical crisis. Its underperformance in this conflict is leading institutional analysts to reassess Bitcoin’s role in a wartime portfolio.
5. Inside Iran: The 700% Spike in Crypto Outflows
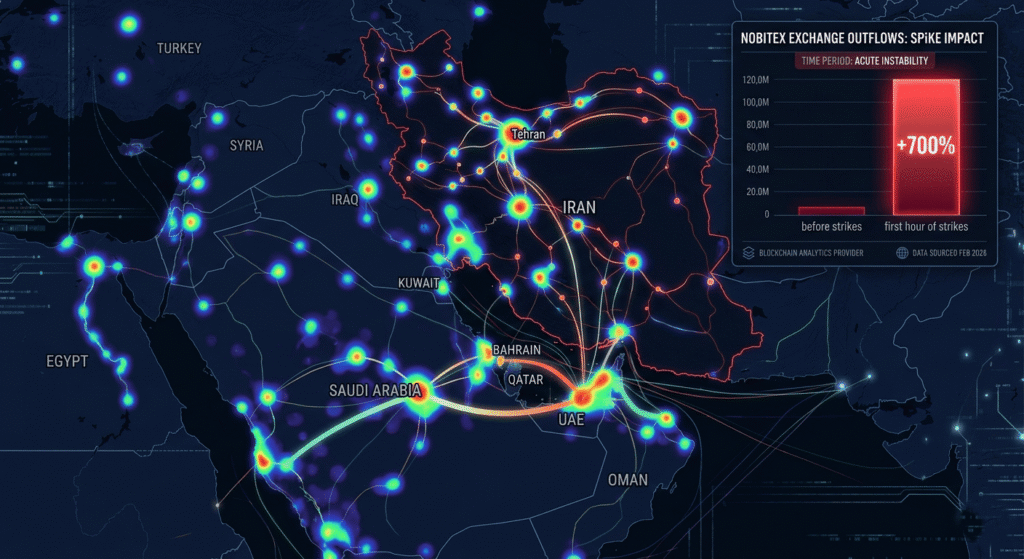
Nobitex Exchange: Iran’s largest cryptocurrency exchange | Nobitex
The narrative most Western coverage misses is what happened inside Iran the moment the strikes began. Blockchain analytics firm Elliptic recorded a 700% spike in outflows from Nobitex, Iran’s largest cryptocurrency exchange, in the minutes following the first airstrikes.
This is not surprising to anyone who has watched crypto adoption in sanctions-heavy economies. Iran has had one of the world’s most active crypto underground economies for years, precisely because sanctions had already cut off large portions of the population from traditional international banking. The war has intensified that dynamic sharply.
The broader pattern holds across conflict history: when states face war, sanctions, or currency collapse, citizens and businesses turn to crypto as a portable store of value and cross-border payment mechanism. In this conflict, that behaviour is visible, real-time, and measurable on-chain.
| Meanwhile, Gulf crypto infrastructure has been directly impacted. Dubai’s flagship Token2049 conference was cancelled due to the conflict — a significant blow to a region that had become one of crypto’s most important institutional hubs. |
6. Market Sentiment: Extreme Fear, But Resilient Prices
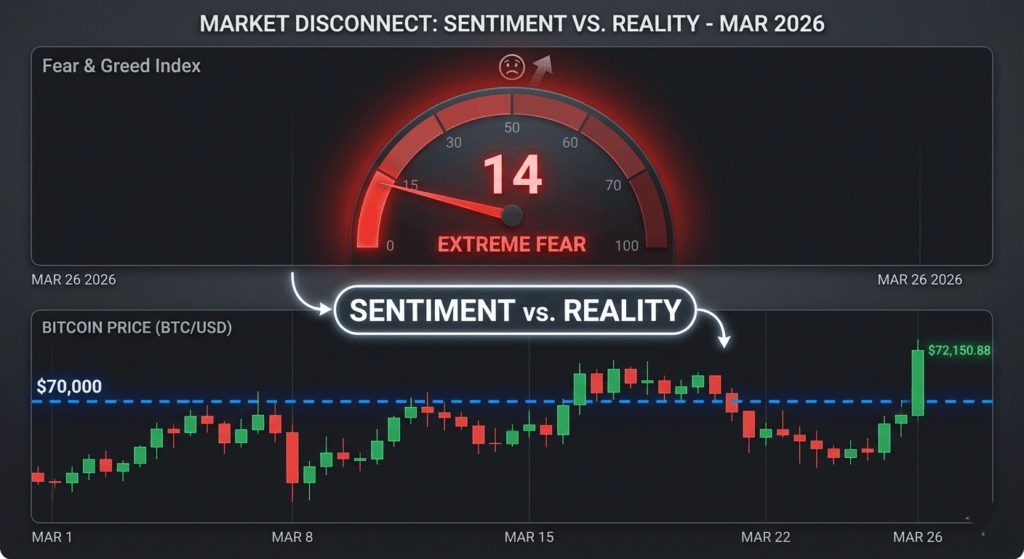
One of the most interesting features of the current market is a stark disconnect between sentiment indicators and actual price performance.
The Sentiment Picture
- Fear & Greed Index: Sitting at 14 — deep in “Extreme Fear” territory (Interactive Crypto, March 25, 2026)
- Bitcoin funding rates: Negative since early March — the longest such stretch since April 2025, when BTC ultimately bottomed around $76,000 (CoinDesk, March 12)
- VIX (Wall Street fear index): Jumped to 25 this week, its highest in over a year
- Bitcoin OG sell-off: Long-term holders sold over 1,650 BTC ($117M) after the Fed’s hawkish March 18 decision
Yet Prices Are Holding
Despite all of that, Bitcoin has gained roughly 11% since the conflict began and is holding above $71,000 today. The CMF (Chaikin Money Flow indicator) shows capital continuing to rotate back in after each dip — similar to the early weeks of the Russia-Ukraine war in 2022, though with more volatility this time.
FxPro chief market analyst Alex Kuptsikevich noted: “Although the leading cryptocurrency did not immediately capitalize on the upward momentum, simply remaining at these high levels now suggests confidence among the bulls.” (CoinDesk, March 25, 2026)
7. What Comes Next: The Scenarios
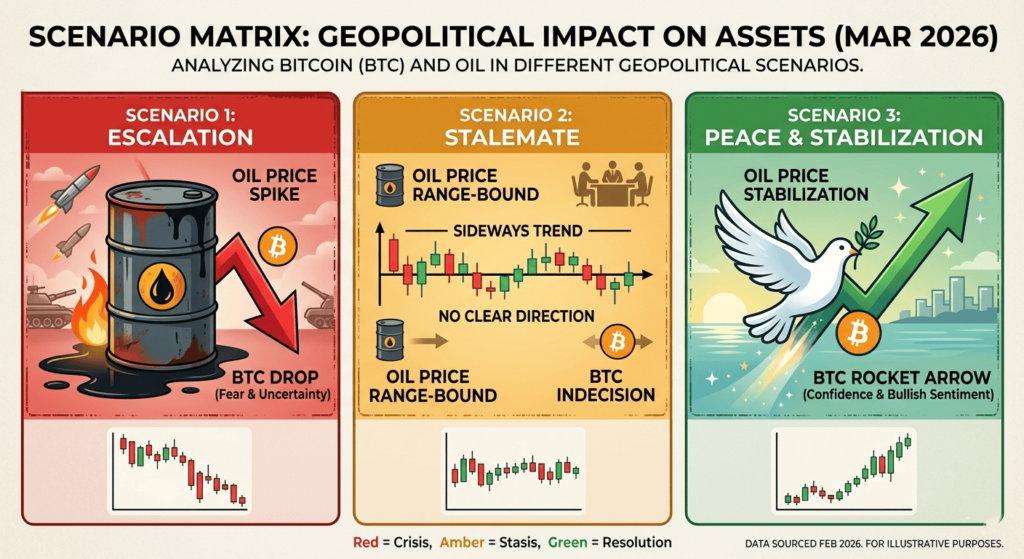
Bernstein analysts, in a March 24 investor note, maintained a year-end Bitcoin price target of $150,000 — more than double today’s level — citing Michael Saylor’s ongoing accumulation, continued ETF inflows, and a belief that Bitcoin has found its cycle trough. The question is which of three scenarios plays out first:
Scenario 1: Major Escalation — Bearish Near-Term
A strike on Iranian power plants or a full Hormuz closure triggers a significant oil shock above $120. The Fed is forced further hawkish. Crypto correlates with risk assets and breaks below $65,000. However, analysts note that even in this scenario, the rising floor pattern suggests strong long-term buyer conviction.
Scenario 2: Prolonged Stalemate — Sideways
Conflict continues but does not significantly escalate. Oil stays in the $90–$105 range. The Fed holds rates. Bitcoin consolidates in a $65,000–$78,000 range, continuing its pattern of higher lows but unable to break through the $73,000–$74,000 ceiling that has rejected it four times.
Scenario 33: De-escalation / Peace Deal — Bullish
The US 15-point peace plan reported today (March 25) is the most concrete diplomatic development since February 28. If it gains traction: oil falls back toward $80, inflation expectations ease, the Fed revives rate cut talk, and the main bullish catalysts for crypto reactivate. Analysts see $80,000–$90,000 as the near-term range in this scenario.
Key Takeaways for Crypto Investors and Builders
- Crypto is now the world’s 24/7 geopolitical risk market. Every escalation registers in Bitcoin before any other asset can respond.
- Bitcoin is showing safe-haven-like resilience — up 11% since the war began while gold has fallen 17%.
- Oil and Fed policy are the true drivers. The rate-cut bullish thesis is on hold until Brent drops back to $80–85.
- Crypto adoption accelerates in conflict zones. Iran’s 700% exchange outflow spike shows real-world utility in action.
- Trump’s posts now move markets. $1B+ in liquidations can occur within hours of a single statement.
- The peace plan is the market’s biggest near-term catalyst. Watch oil prices and diplomatic headlines closely.
This blog is for informational purposes only and does not constitute financial or investment advice. The situation described is active and evolving. Always verify current developments from authoritative news sources before making any financial decisions.